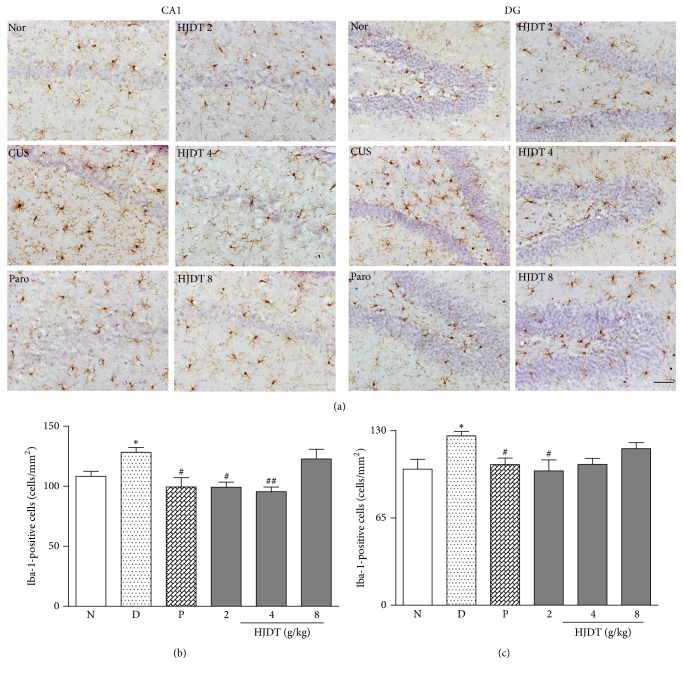
Figure 7.
Effect of HJDT on the microglia morphology and number in the hippocampal CA1 region and DG after the CUS. The representative morphology and the number change of microglia in all groups (a). The number of Iba-1 positive cells in hippocampal CA1 region increased in CUS depression group and was reversed with paroxetine and HJDT (2, 4 g/kg) treatments (b). The number of Iba-1 positive cells in hippocampus DG increased in CUS depression group and was reversed with paroxetine and HJDT 2 g/kg treatment (c). ∗p < 0.05 relative to the normal control group; #p < 0.05 and ##p < 0.01 relative to the CUS depression group. Nor/N: normal control group; CUS/D: CUS depression group; Paro/P: paroxetine group; HJDT 2: HJDT 2 g/kg group; HJDT 4: HJDT 4 g/kg group; HJDT 8: HJDT 8 g/kg group. Scale bar = 100 μm, ×200.

