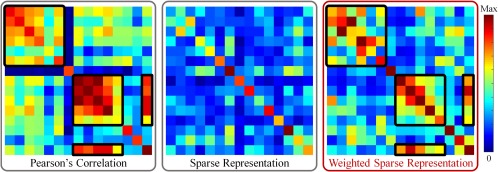
Figure 1.

Illustration of our motivation. Note that these networks are obtained from real rs‐fMRI data (where all values are absolute). The black boxes in the matrices are used to show the corresponding effect of the connectivity strength‐based weights in the constructed brain network. [Color figure can be viewed at http://wileyonlinelibrary.com]
