Fig. 7.

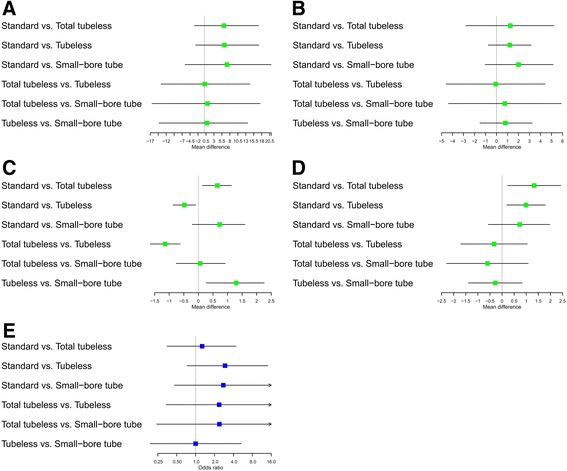
Forest plots for (a) operation time, b visual analogue scale, c hemoglobin change, d hospital stay, and e transfusion rate using network meta-analysis

Forest plots for (a) operation time, b visual analogue scale, c hemoglobin change, d hospital stay, and e transfusion rate using network meta-analysis