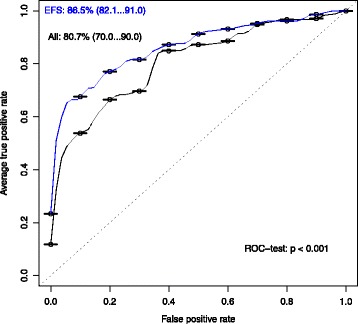
Fig. 2.

Performance of LR model. On the y-axis the average true positive rate (i.e., sensitivity) and on the x-axis the false positive rate (i.e., 1-specificity) is shown. Two ROC curves are shown: of all features (black) and the EFS selected features (blue). The dotted line marks the performance of random guessing
