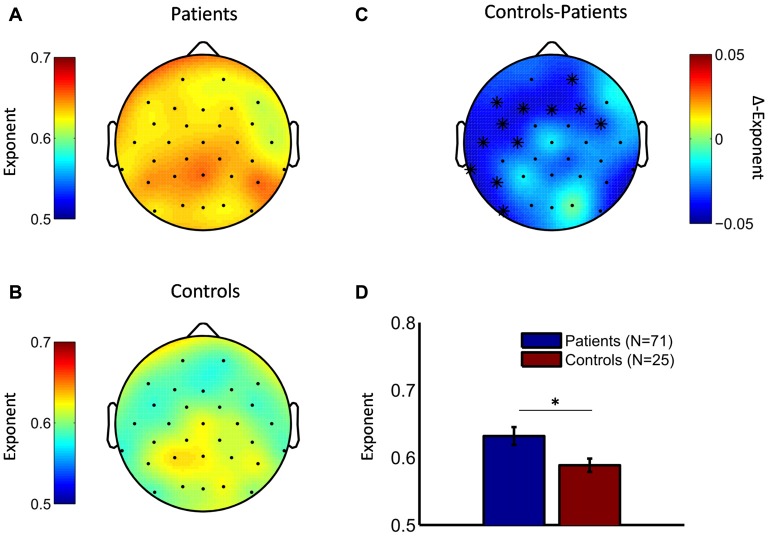
Figure 2.
Depressive patients exhibit stronger long-range temporal correlations (LRTC) in theta oscillations compared to healthy controls. Topographic distributions of the DFA exponents point to strongest LRTC in theta oscillations in the parietal region both in depressive patients (A) and healthy controls (B). (C) The difference topography (controls minus patients) indicates that patients had stronger LRTC in many cortical areas. Cluster-based permutation statistic revealed a significant cluster in left temporal and frontal regions (cluster-electrodes are marked with a star). (D) Mean exponent values at a central cluster-electrode (FC5, t-statistic, *p < 0.05).

