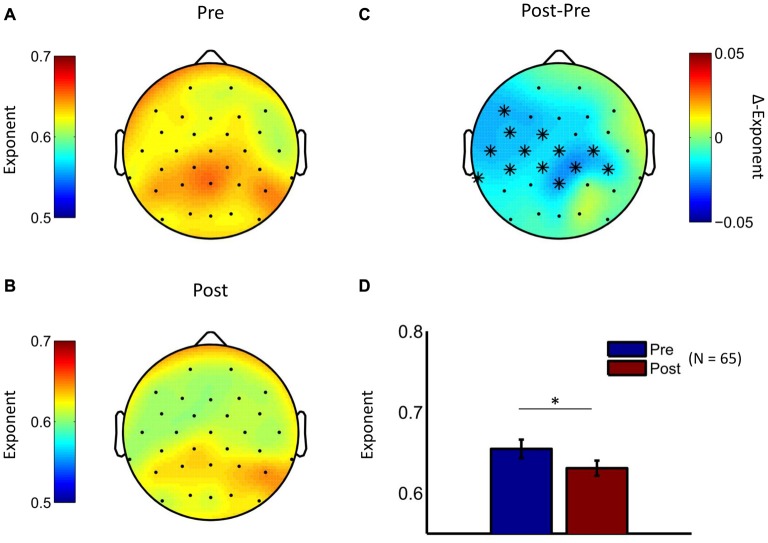
Figure 3.
LRTC in theta oscillations are reduced by psychological treatment. The topographic distribution of DFA exponents in theta oscillations is similar for the baseline measurement (A) and the post-treatment measurement (B) for the pooled treatment groups. (C) The difference topography (Post minus Pre) indicates widespread reductions in LRTC due to interventions. Cluster-based permutation statistic revealed a significant cluster at widespread electrode locations (cluster-electrodes are marked with a star). (D) Mean exponent values at a central cluster-electrode (Pz, t-statistic, *p < 0.05).

