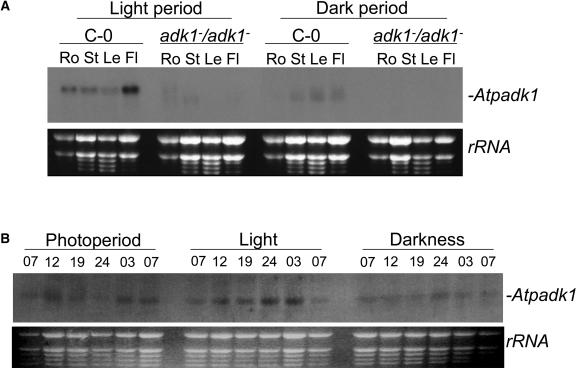
Figure 3.
Expression analysis of Atpadk1 mRNA. A, Northern blot of total RNA extracted from different tissues of wild type (C-0) and homozygous mutant (adk1−/adk1−) in the middle of the light and dark periods. Ro, Root; St, stem; Le, leaf; and Fl, flower. B, Northern blot of leaves RNA from wild-type plants growing under conditions described in “Materials and Methods.” Bottom sections show rRNA as a loading control.

