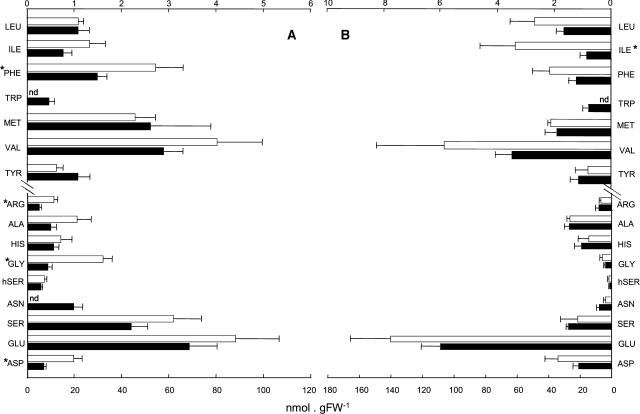
Figure 7.
Amino acid levels in leaves of adk1− Arabidopsis plants measured 6 h into either the light (A) or the dark (B) periods. Plants were grown as described for Figure 5. Black bars correspond to Col-0 plants and white ones to homozygous mutant (adk1−/adk1−). Values are means ± se of measurements from four to six plants per genotype. Asterisks indicate those that were determined by the Student's t test to be significantly different between genotypes. Nd, Not detectable.

