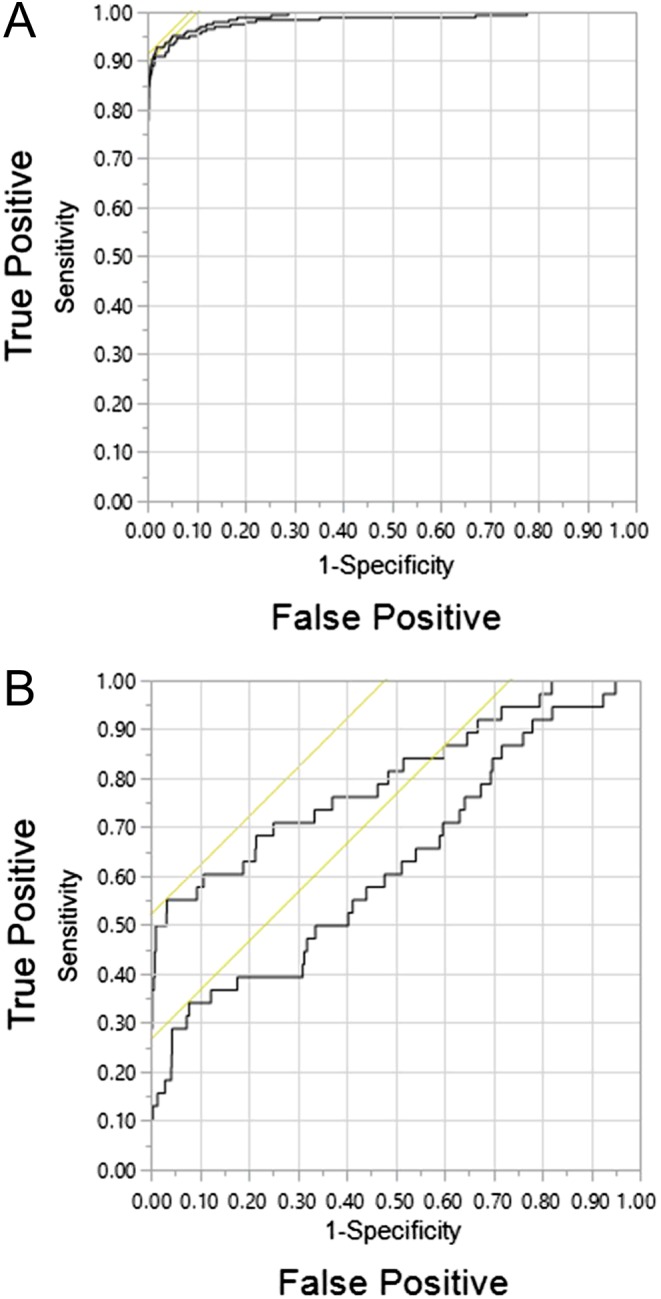
Figure 3.

Receiver operating characteristic curves for diagnosis of PPGLs (A) and HNPGLs (B). Curves are shown for combinations of normetanephrine and metanephrine (lower curve) vs normetanephrine, metanephrine and methoxytyramine (upper curve). A full color version of this figure is available at http://dx.doi.org/10.1530/EJE-17-0077.

 This work is licensed under a