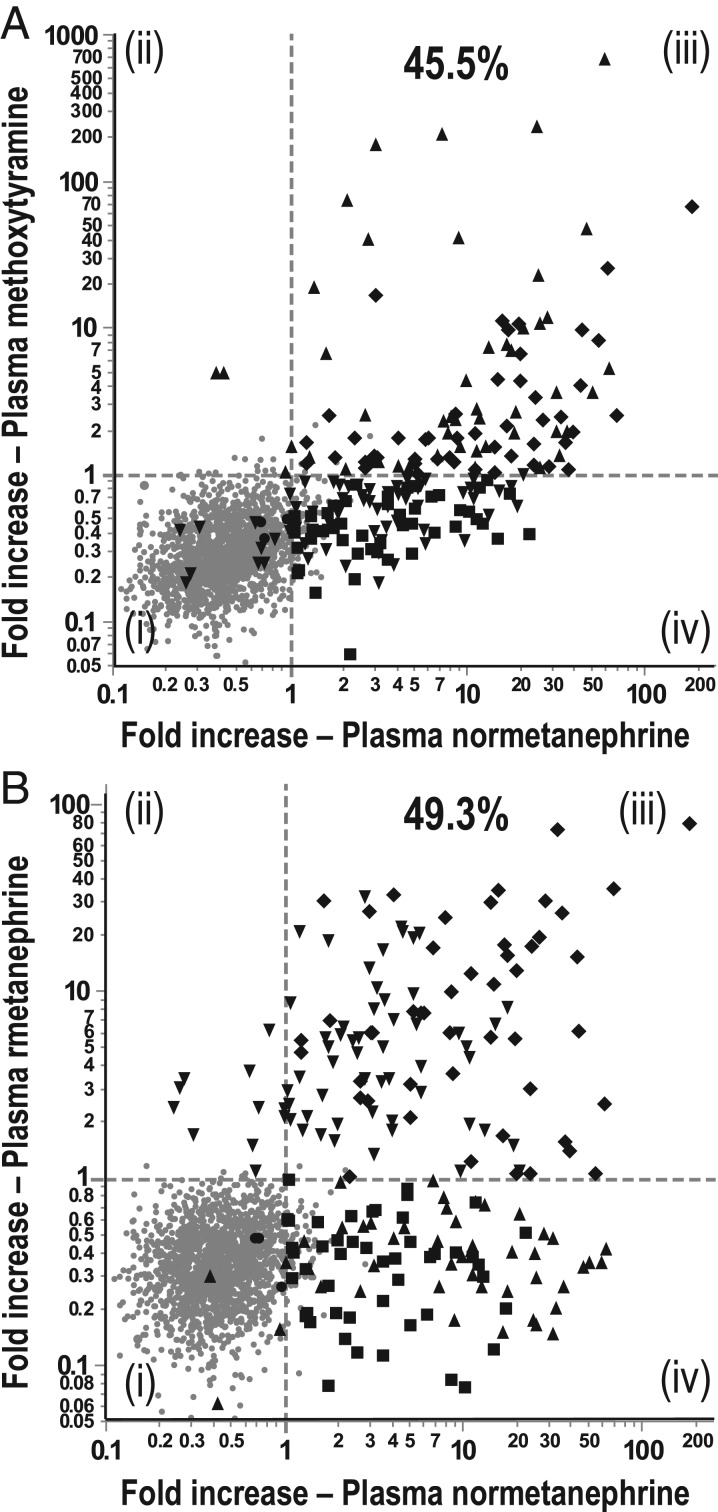
Figure 4.
Relationships of fold increases of plasma normetanephrine above upper cut-offs vs fold increases above upper cut-offs for methoxytyramine (A) and metanephrine (B) for patient populations with and without PPGLs. Dashed vertical and horizontal lines to illustrate fold increases of 1.0 at upper cut-offs. Different symbols serve to illustrate patients without tumors (solid gray dot), patients with tumors and positive results for normetanephrine alone (solid black square), for methoxytramine or methoxytyramine and normetanephrine (solid black upward triangle), metanephrine or metanephrine and normetanephrine (solid black downward triangle), all three metabolites (solid black diamond) or no metabolites (solid black dot).

 This work is licensed under a