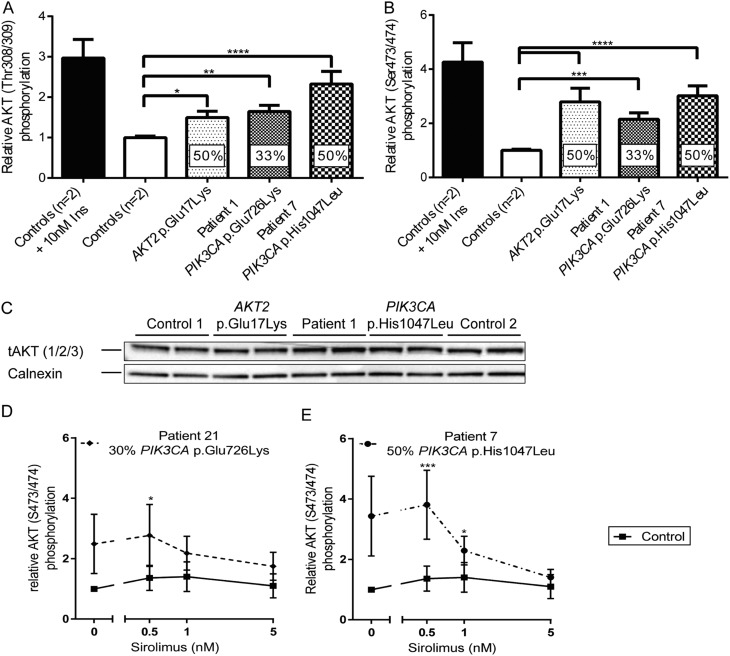
Figure 4.
Signalling downstream from phosphatidylinositol-3-kinase in dermal fibroblasts from patient 1. AKT phosphorylation at Thr308/309 (A) or Ser473/474 (B) was determined by ELISA. Percentages in columns indicate the mutation burden in the cells. Data represent pooled, normalised results from three independent experiments plotted as mean ± s.e.m. One-way ANOVA and post hoc Dunnett’s test were used to assess significance. Insulin stimulation is shown for illustration only and was excluded from this statistical analysis. (C) Immunoblotting for total AKT (1/2/3) from samples used for ELISA (A and B). Representative blot from one of three independent replicates. (D and E) AKT Ser473/474 phosphorylation following 72 h of Sirolimus treatment was quantified using ELISA and normalised to AKT expression determined by immunoblotting. (D) dermal fibroblasts from P21; (E) dermal fibroblasts from P7. Results represent mean ± s.e.m. of three independent replicates. DMSO on its own did not result in a change in phosphorylation (data not shown). Statistical analysis was performed as one experiment and separate graphs are plotted for clarity only. A two-way ANOVA was performed and followed by a post hoc Dunnett’s test comparing all patients to the same control cell line. *P < 0.05, **P < 0.01, ***P < 0.001, ****P < 0.0001.

 This work is licensed under a