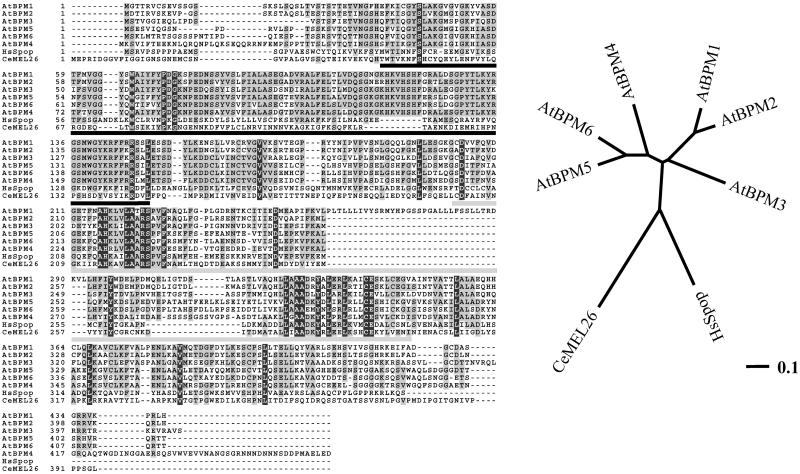
Figure 1.
Protein alignment (left) and unrooted phylogenetic dendrogram (right) of the AtBPM family, CeMEL26 (NP_492449), and HsSpop (AAH03385). Underlined in black is the MATH domain, whereas light gray indicates the position of the BTB/POZ domain. Identical residues are in black and conserved amino acid residues are in gray, respectively. Line in the lower right of the dendrogram gives the distance between each branch (percentage divergence/100). Graphics were done on the Workbench Web site (http://workbench.sdsc.edu) using ClustalW, PHYLIP, and Boxshade version 3.3.1 programs. Trees were generated using the neighbor-joining method (Saitou and Nei, 1987); protein grouping was verified by bootstrapping (1,000 replicates, 111 random seed number; Felsenstein, 1985).

