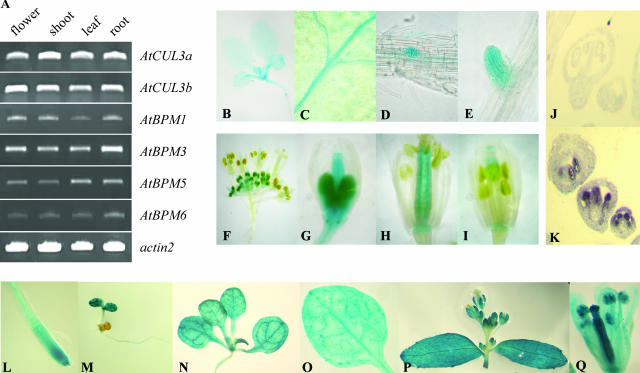
Figure 6.
Expression pattern of AtCUL3a, AtCUL3b, and the four tested AtBPM genes. A, Semiquantitative RT-PCR shows expression of all tested genes in root, leaf, shoot, and flower. B to I, Analysis of AtCUL3a promoter GUS lines showed GUS expression in all organs (B, seedling; C, close up to vascular tissue; D and E, lateral roots; F–I, inflorescence). J and K, GUS expression was confirmed for flower tissue by in situ hybridization. Expression was detectable in pistil and anthers (J, sense; K, antisense). L to Q, Analyses of AtCUL3b promoter GUS lines showed expression similar to pAtCUL3a∷GUS lines in all tested tissues (L, root; M, seedling; N, rosette leafs; O, leaf close up; P, inflorescence with two cauline leafs; Q, flower).

