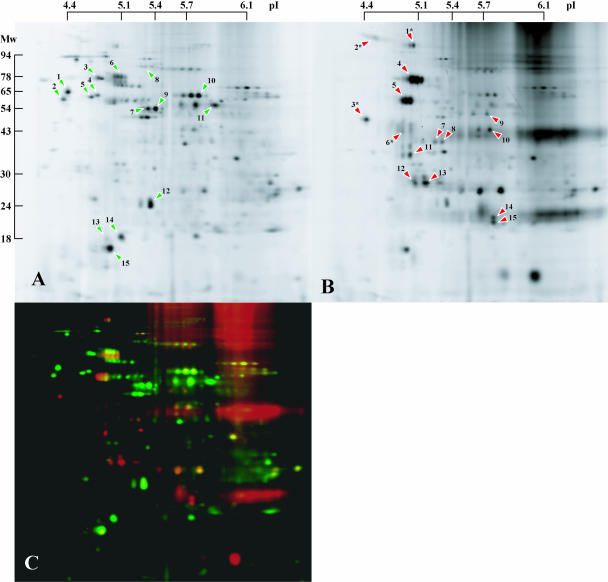
Figure 3.
2D-DIGE analysis of Arabidopsis DRMs. TM and DRM fractions were labeled with fluorescent CyDyes, mixed, and separated in single 2D gels. Proteins were detected with a fluorescence scanner. A typical pair of scans is shown. A, TMs. B, DRMs. C, False color overlay of TMs (green) and DRMs (red). Green arrowheads in A indicate Arabidopsis ER, Golgi, and mitochondrial proteins that were depleted from the DRM fraction. Red arrowheads in B indicate proteins specifically enriched in the DRM fraction that were identified by MS/MS. GAPs are marked by an asterisk. Numbers on arrowheads correspond to the identifications listed in Table I.

