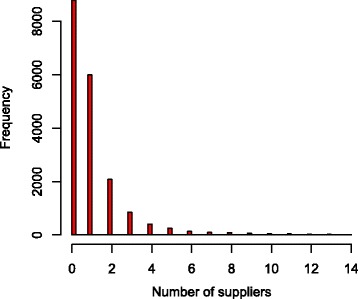
Fig. 1.

The frequency distribution of the number of suppliers used per farm. This figure is based on a dataset with the number of suppliers for 19,015 Danish dairy herds registered between 01 March 2014 and 28 February 2015, using fewer than 50 suppliers. In this plot, only farms using fewer than 15 suppliers are shown
