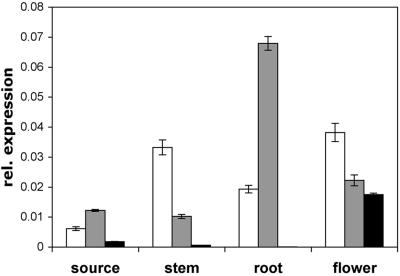
Figure 4.
Expression analysis of AtProT1, 2, and 3 in Arabidopsis. Expression was analyzed by relative quantification using real-time PCR, with the ubiquitin mRNA as a reference. RNA from source leaves, stems, roots, and flowers of soil-grown plants was analyzed. Expression of AtProTs is given relative to ubiquitin mRNA levels and is the mean of three different reactions ± sd. Similar results were obtained using independent RNAs as a template. White bars, AtProT1; gray bars, AtProT2; black bars, AtProT3.

