
Fig. 4.
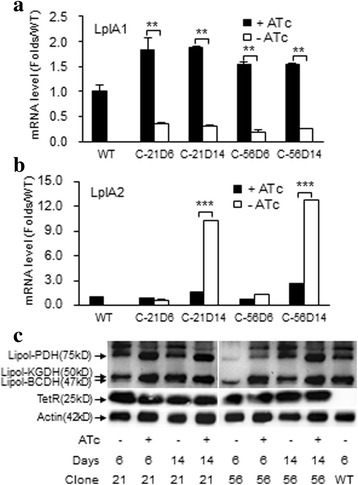
Levels of lplA1 and lplA2 mRNA expression and lipoylated KADHs by cloned LplA1-cKO parasites collected in early and late stage infection. a lplA1 mRNA levels determined by quantitative PCR. Data are mean ± SD from three analyses. **P < 0.01 (Student’s t-test). b lplA2 mRNA levels determined by quantitative PCR. ***P < 0.001 (Student’s t-test). c Levels of lipoylated PDH, KGDH and BCDH were analysed by protein blotting using specific antibodies. TetR protein levels were analyzed in parallel. Actin was used for control of sample loading