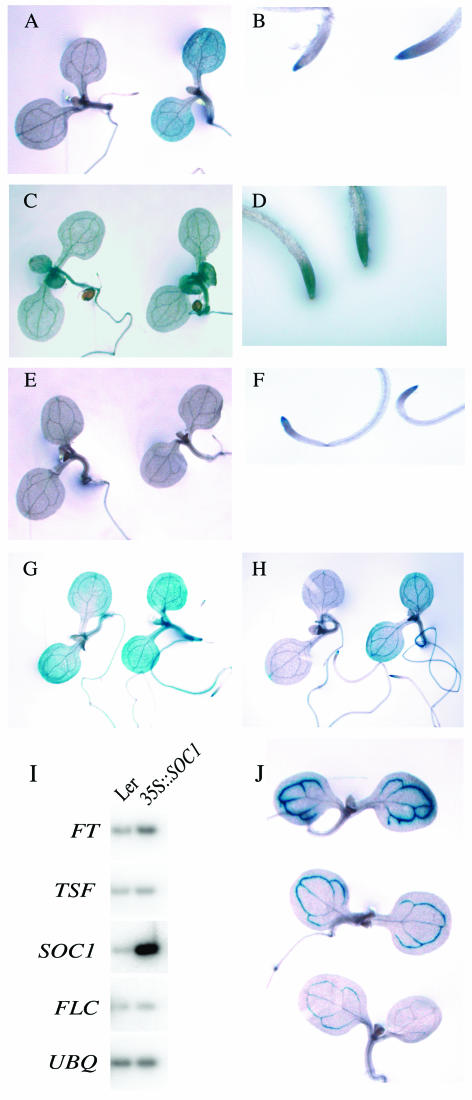
Figure 3.
Histochemical analysis of the interactions between FLC, SOC1, TSF, and FT. To minimize variation in GUS staining, plants that appear in the same section were grown, fixed, and stained in parallel. A and B, Effect of FRI on SOC1∷GUS expression. F1 seedlings and root tips resulting from the cross of SOC1∷GUS to FRI-Col (left) or Ws (right). C and D, FLC∷GUS expression in seedlings and root tips in a FRI-containing background. E and F, Comparison of the effects of FRI and 35S∷FLC on SOC1∷GUS expression. F1 seedlings and root tips resulting from the cross of SOC1∷GUS to FRI-Col (left) or 35S∷FLC (right). G, Effect of FT activation on SOC1∷GUS expression. F1 seedlings resulting from the cross of SOC1∷GUS to Ws (left) and the FT activation mutant (right). Plants are in a fri-null background. H, Effect of TSF activation on SOC1∷GUS expression. F1 seedlings resulting from the cross of SOC1∷GUS to FRI-Col (left) and to the TSF activation mutant (right). Plants are in a FRI-containing background. I, Effect of SOC1 overexpression. RT-PCR analysis of FT, TSF, SOC1, and FLC expression in wild-type and 35S∷SOC1 lines. UBIQUITIN (UBQ) was included as a control for loading. Plants are in the Landsberg erecta (Ler) background. J, Inhibition of FT expression by FRI and FLC. F1 seedlings resulting from the cross of FT∷GUS in a Col background to Col (top), FRI-Col (middle), or 35S∷FLC (bottom).

