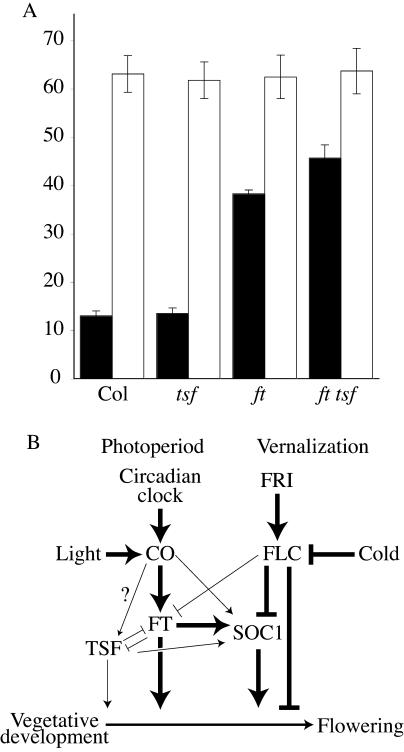
Figure 4.
Interactions between flowering time genes. A, Flowering phenotype of tsf loss-of-function mutations in wild-type and ft-mutant backgrounds. Black and white bars represent plants grown in LD and SD, respectively. Flowering time is expressed as the number of rosette leaves formed by the primary shoot apical meristem prior to the initiation of flowering. Error bars indicate 1 sd. B, A model for the regulatory relationships between flowering genes. Line thickness is intended as a speculative measure of the strength of promotion or inhibition.

