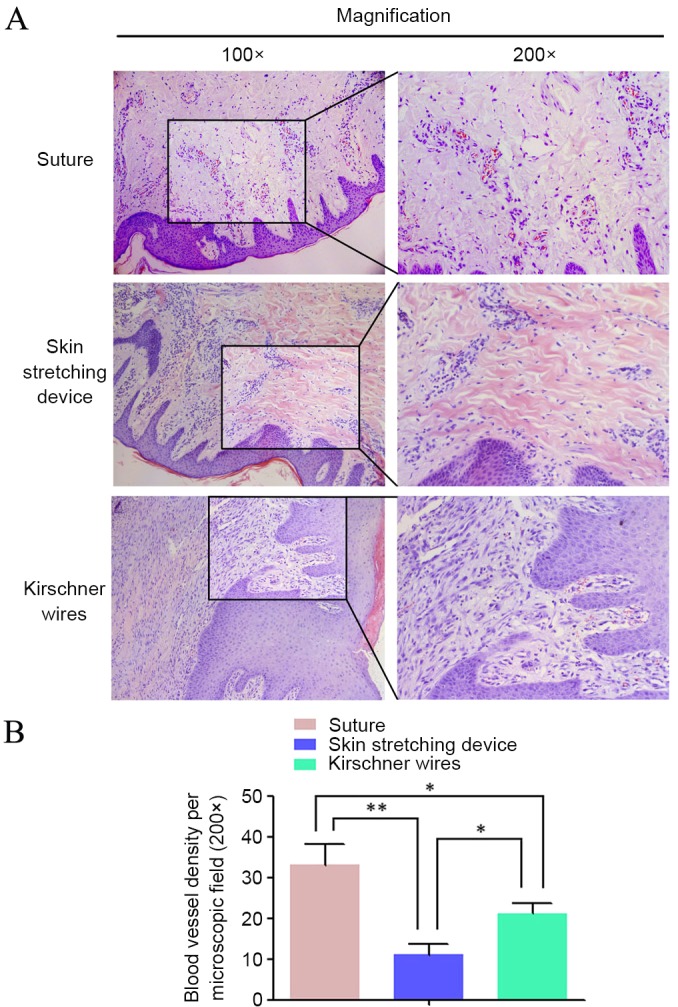
Figure 7.

(A) Hematoxylin and eosin staining highlighted the distribution of microvessels, where the microvessel density in the direct suture group was higher than the others. (B) Microvessel density in different groups was compared with each other. Data are expressed as the mean + standard deviation from at least three experiments. *P<0.05 and **P<0.01.
