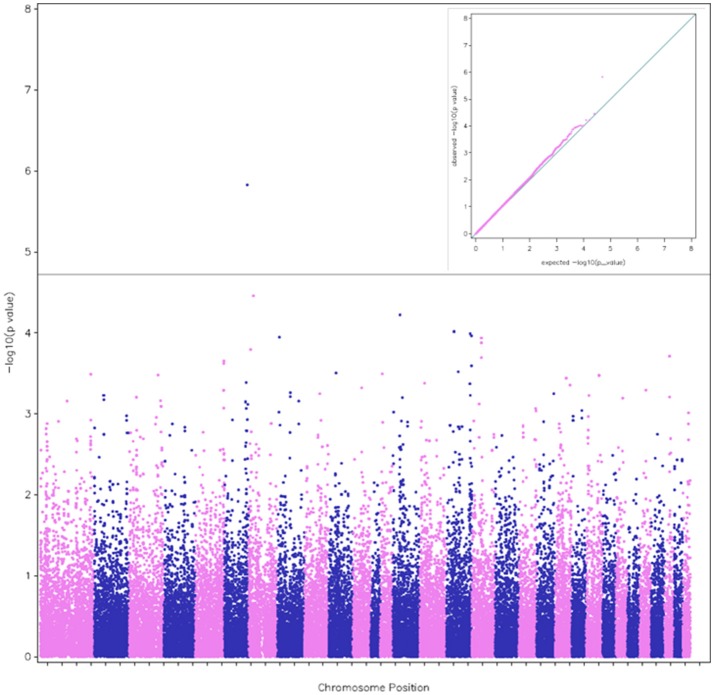
Figure 1.
A Manhattan plot of the genome-wide associations with race distance. The plot was calculated from model (1), which detected the SNP BIEC2_1022884 on Chr 6. The red line indicates the Bonferroni-corrected significance level (p = 1.9 × 10⁻⁵). The alternative colors blue and pink indicate the successive chromosome (Chr) positions from Chr 1 to 31 (autosomal chromosomes). The corresponding quantile-quantile (QQ) plot of observed vs. expected −log10(p) values is shown in the inset.

