
Figure 2.
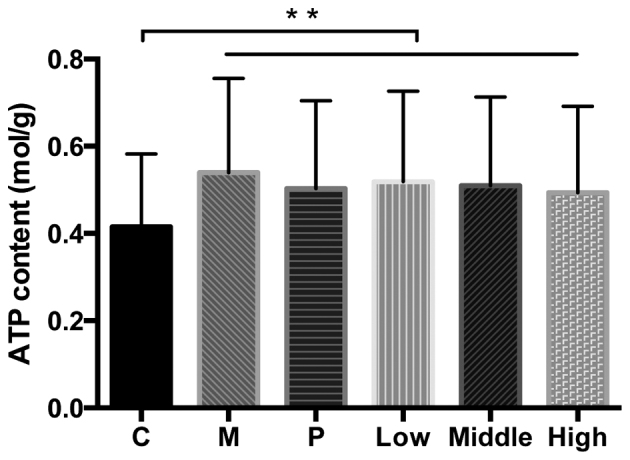
ATP content of mesangial cells. Data are presented as the mean ± standard error of the mean. **P<0.01. ATP, adenosine 5′-triphosphate; C, control group; M, high glucose-induced group; P, captopril group; Low, group treated with 0.2 µmol/l rutin; Middle, group treated with 0.4 µmol/l rutin; High, group treated with and 0.8 µmol/l rutin.