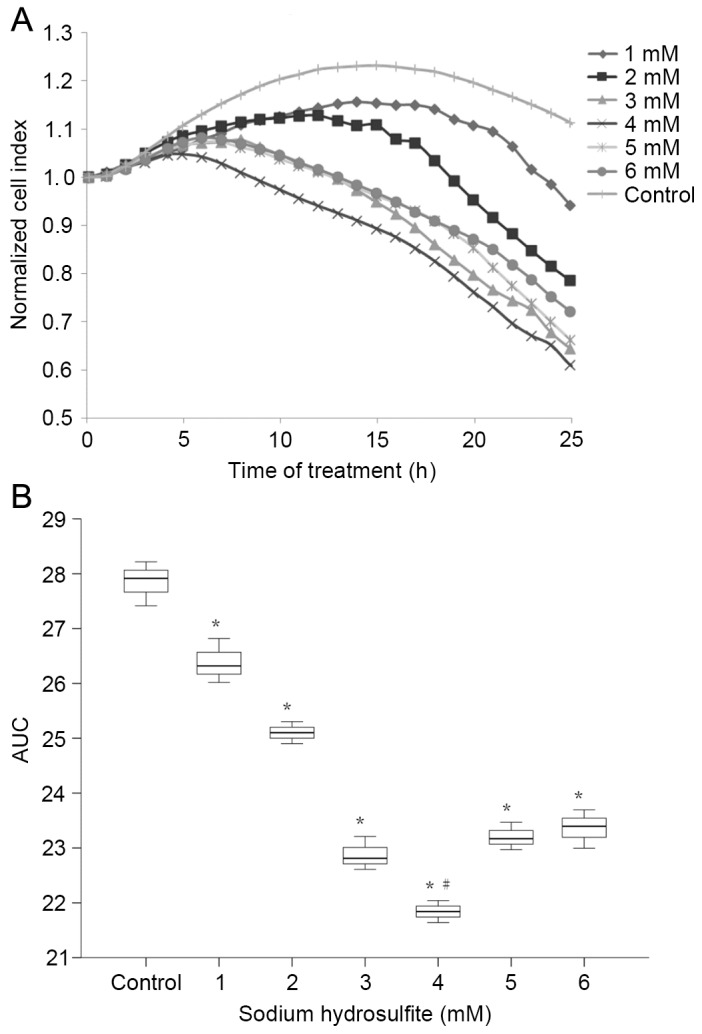
Figure 3.

(A) Normalized cell index and (B) AUC calculations of neonatal rat cardiomyocytes after exposure to sodium hydrosulfite. Data are presented as the mean ± standard error of the mean. *P<0.01 vs. Control; #P<0.01 vs. all other groups. Control, normal media group without sodium hydrosulfite; AUC, area under the time-course curve.
