Figure 2.
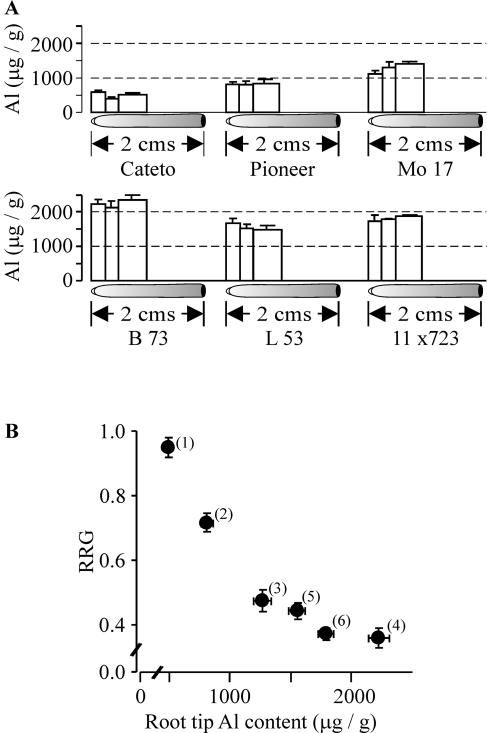
Relationship between root Al content and Al resistance. A, Diagram illustrating the magnitude and spatial distribution of Al-tissue content along the first centimeter of the root apex of the six maize genotypes grown for 5 d in full nutrient solution plus 40 μm Al3+ activity. The bars indicate the magnitude of Al content at a given position, and the bar's width corresponds to the length of root segment along the root in which Al content was determined. Vertical bars indicate the SEM. B, Relationship between Al content and Al resistance, as measured by RRG in full nutrient solutions containing 40 μm Al3+ activity as shown in Figure 1. Al content values represent the average of Al content measured over the first centimeter of the root (data shown in A). The numbers refer to the different maize genotypes in order of decreasing Al resistance: highly Al-resistant Cateto-Colombia (no. 1), moderately Al-resistant Pioneer (no. 2), and Al-sensitive Mo17 (no. 3), B73 (no. 4), L53 (no. 5), and 11 × 723 (no. 6).

