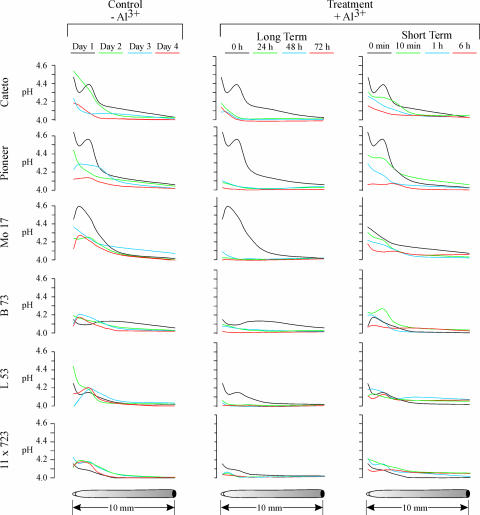
Figure 7.
The diagram illustrates changes in rhizosphere pH measured with pH microelectrodes at 30 μm from the root surface along the terminal 10 mm of the maize root in the absence of Al (left column) and upon long (center column) and short (right column) Al-exposure periods. The six maize genotypes (rows) are labeled on the left side of the figure. The pH measurements were performed at the time periods that are color labeled at the top of each column. Each result is a representative of measurements done in for least three different roots of each maize genotype. The scale bars at the bottom of the figure indicate the position along the root.

