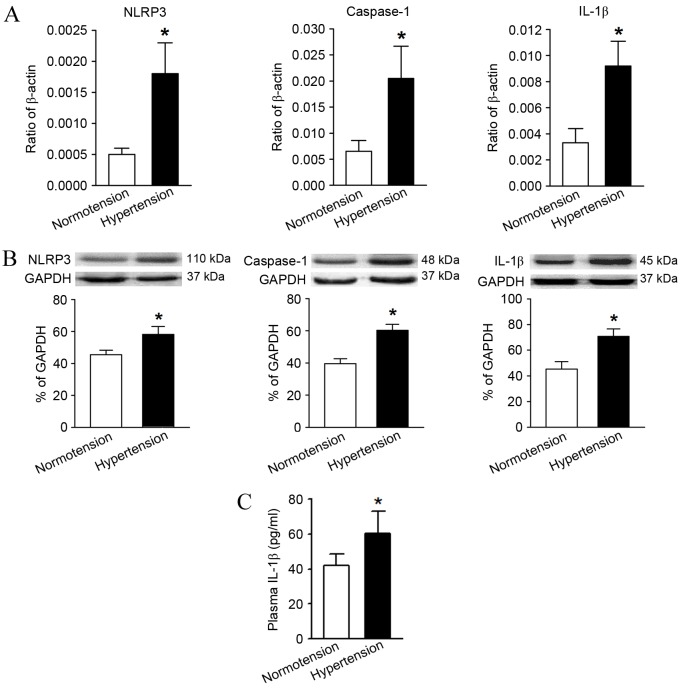
Figure 3.
Comparison of the expression levels of molecules associated with the NLRP3 inflammasome pathway and its downstream product, IL-1β, between the normotension and hypertension groups. (A) Reverse transcription-quantitative polymerase chain reaction and (B) western blot analysis indicated the relative mRNA and protein expression levels, respectively, of NLRP3, caspase-1 and IL-1β. These levels were significantly higher in the hypertension group compared with the normotension group. (C) ELISA results confirmed that the peripheral serum IL-1β content was significantly higher in the hypertension group. *P<0.05 vs. Normotension. IL-1β, interleukin-1β; NLRP3, NLR family pyrin domain containing 3.

