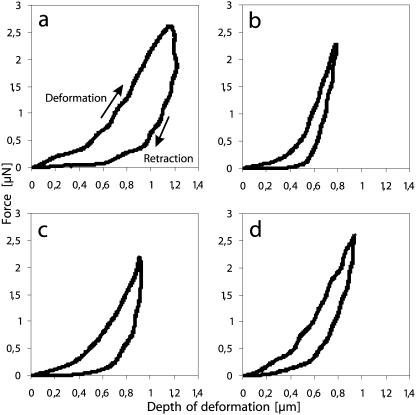
Figure 8.
Force deformation graphs for microindentation experiments. Local deformations were performed at the apex and at a distal location 30 μm behind the tip of growing Solanum pollen tubes. The top curve represents the deforming and the bottom curve the retracting movement of the stylus. The slope of the linear part of the deforming curve indicates the stiffness, whereas the surface area between the two curves expresses the delay upon retraction of the deforming stylus (hysteresis), which is an indication for the dissipated energy and thus the viscoelasticity of the deformed object. The deformation profiles at the distal pollen tube location show that the presence of 1 mg mL−1 lyticase caused a dramatic decrease in stiffness and an increase in viscoelasticity (A) compared to the control (B). At the apex, on the other hand, neither of these parameters was significantly affected by lyticase (C) if compared to the control situation (D).

