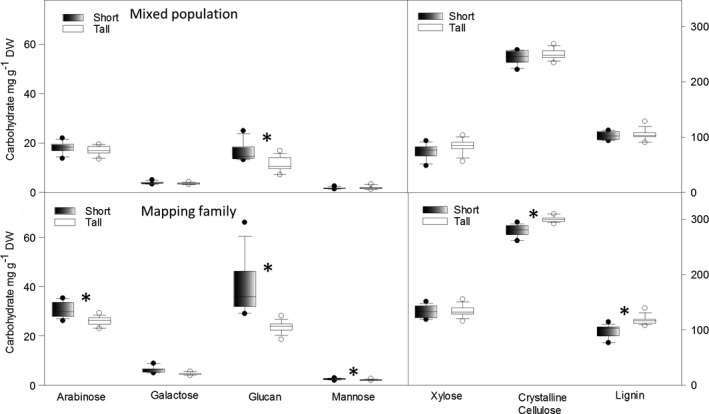
Figure 2.

Quantification of structural carbohydrates and lignin in short and tall genotypes of the mixed population (a) and mapping family (b). Circles show outliers. Significant differences between tall and short plants are shown by an asterisk (Student's t‐test assuming unequal variances, P =≤ 0.05).
