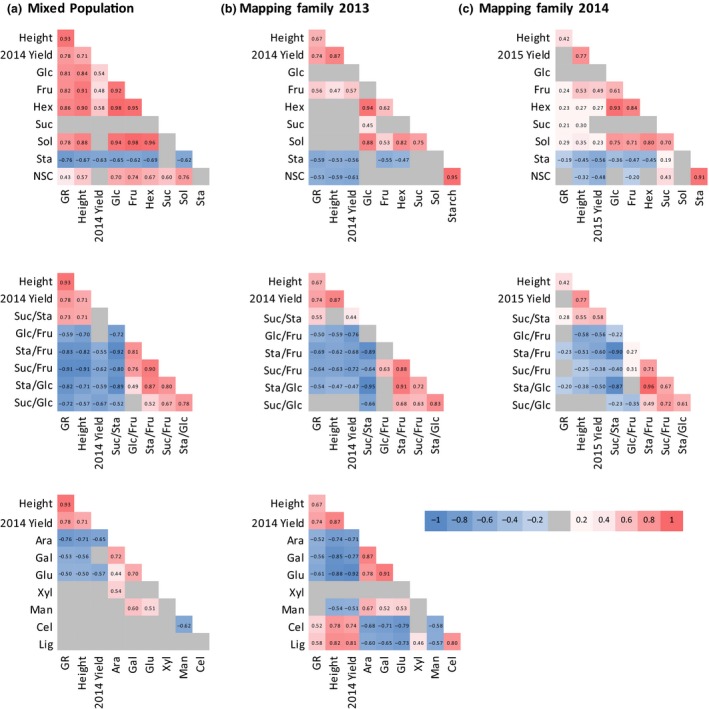
Figure 3.

Spearman's rank correlations between biomass parameters, NSC levels (top) and ratios (middle), and cell wall components (bottom) in the Miscanthus mixed population in 2013 (a) and the mapping family in 2013 (b) and 2014 (c). Significant positive correlations are coloured red, and significant negative correlations are coloured blue (P =≤ 0.05). Nonsignificant correlations are coloured grey. Key: Glc = glucose, Fru = fructose, Hex = total hexose, NSC = total nonstructural carbohydrate, Suc = sucrose, Sta = starch, Glc/Fru = glucose‐to‐fructose ratio, Suc/Glc = sucrose‐to‐glucose ratio, Suc/Fru = sucrose‐to‐fructose ratio, Suc/Sta = sucrose‐to‐starch ratio, Sta/Glc = starch‐to‐glucose ratio, Ara = arabinose, Cel = cellulose, Glu = glucan, Gal = galactose, Lig = lignin.
