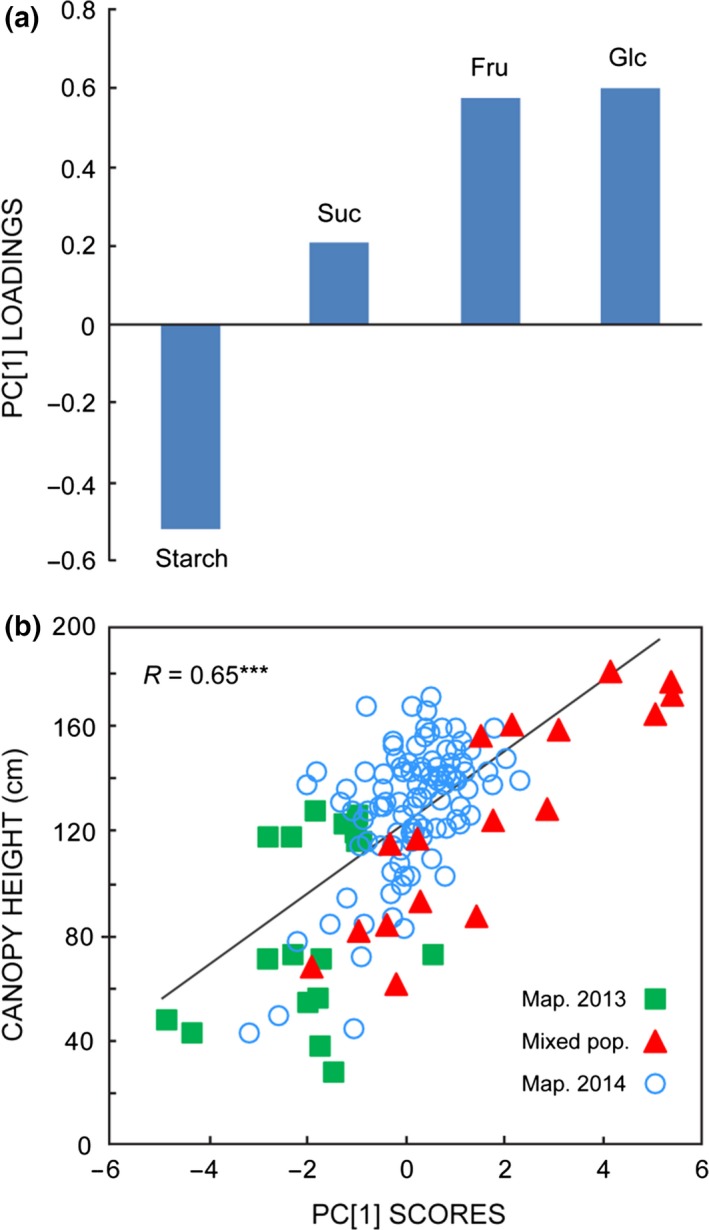
Figure 4.

Correlation of multivariate carbohydrate phenotypes and biomass across all experimental populations. Horizontal axis shows scores on PC[1], the major component (58% of variance) from PCA of NSC levels (Glc, Fru, Suc, starch) of each genotype in the mixed population (triangles), the mapping population selected in 2013 (squares) and the extended mapping family analysed in 2014 (open circles). Vertical axis shows mean canopy height of each sampled genotype. R indicates Pearson correlation (***, P < 0.001) between heights and PC[1] scores.
