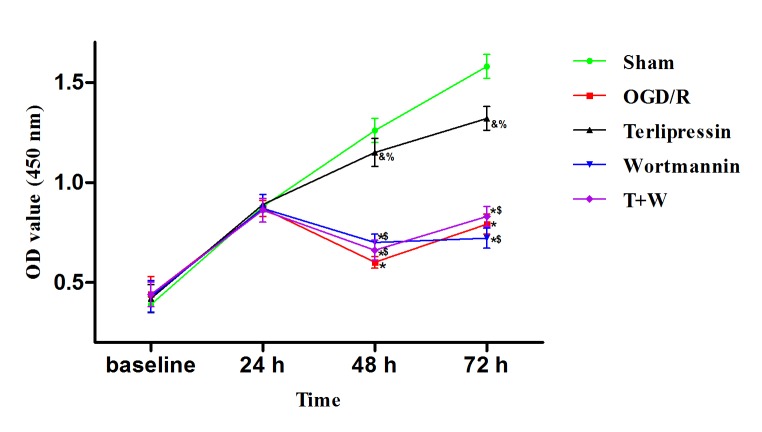
Figure 4.
Changes in IEC-6 cell proliferation following OGD/R. IEC-6 cell proliferation (OD value) assessed by cell counting kit-8 assay in each group was shown. Data is expressed as the mean ± standard deviation, n=5. Results were compared by two-way analysis of variance with repeated measures. *P<0.01 vs. the Sham group; &P<0.05 vs. the Sham group; %P<0.05 vs. the OGD/R group; $P<0.01 vs. the Terlipressin group. OGD/R, oxygen and glucose deprivation/re-oxygenation; T: terlipressin, W, wortmannin; OD, optical density.

