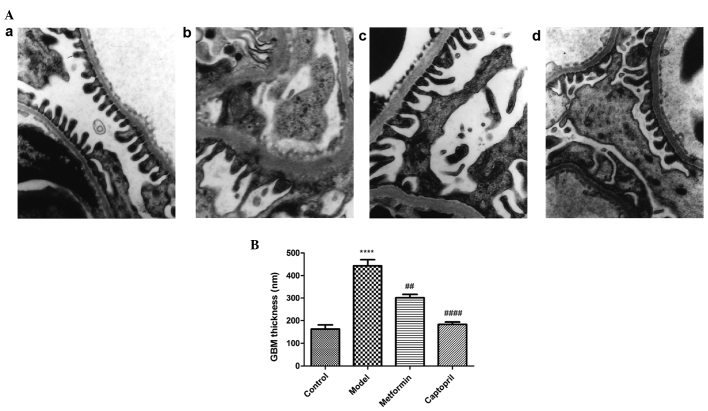
Figure 5.
Representative transmission electron microscopy images of kidney cortices (A) in (a) normal, (b) model, (c) metformin-treated and (d) captopril-treated rats (magnification, ×15,000). (B) Quantitative analysis of glomerular basement membrane (GBM) thickness. Data are presented as the mean ± standard error of the mean. ****P<0.0001, vs. the normal group; ##P<0.01 and ####P<0.0001, vs. the model group.

