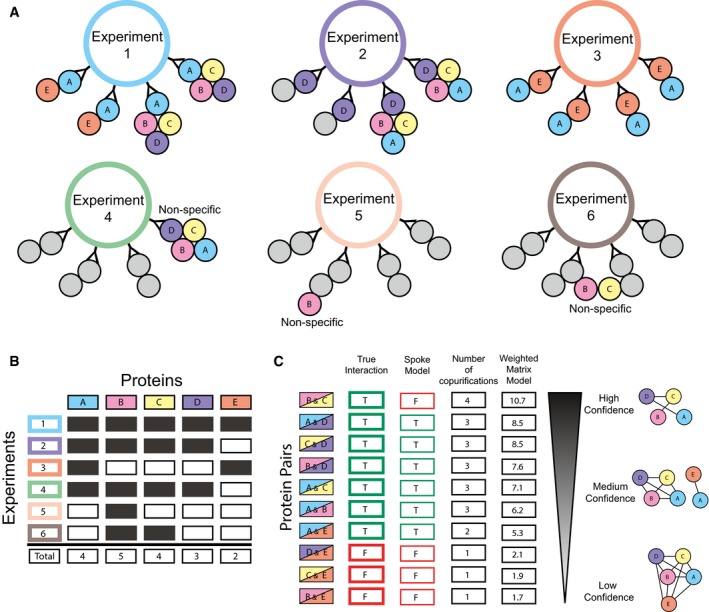
Graphical depiction of six AP‐MS experiments highlighting the purification of two mutually exclusive complexes A‐B‐C‐D and A‐E. Experiments 1, 2, and 3 co‐purify interactions with bait proteins A, D, and E, respectively. Experiments 4, 5, and 6 show non‐specific interactions for the complexes or sub‐complexes. For the purposes of this example, proteins A, B, C, D, and E are only observed in these six experiments out of a set of 50 experiments (arbitrarily defined).
Calculation of weighted matrix model score for protein pairs in highlighted complexes. The True Interaction column represents whether the pair of proteins is co‐complex or not. The Spoke Model column represents the predictions made by the traditional spoke model. Note the spokes model's false‐negative prediction of interaction B&C. The Number of co‐purifications column represents the number of experiments for which the pair of proteins is co‐purified. The Weighted Matrix Model column represents the −1*log(P‐val) of the hypergeometric test given the experimental overlap value, each protein's total number of observed experiments, and the total number of experiments (non‐depicted) arbitrarily defined as 50. The panel also shows likely clusters of co‐complex interactions using three levels of confidence, high, medium, and low. Note, the high‐ and medium‐confidence networks do not show the false‐positive interactions D&E, C&E, or B&E but do capture the true‐positive prey–prey interaction B&C.