
Figure EV4. hu.MAP recapitulates IFT‐A and IFT‐B complexes.
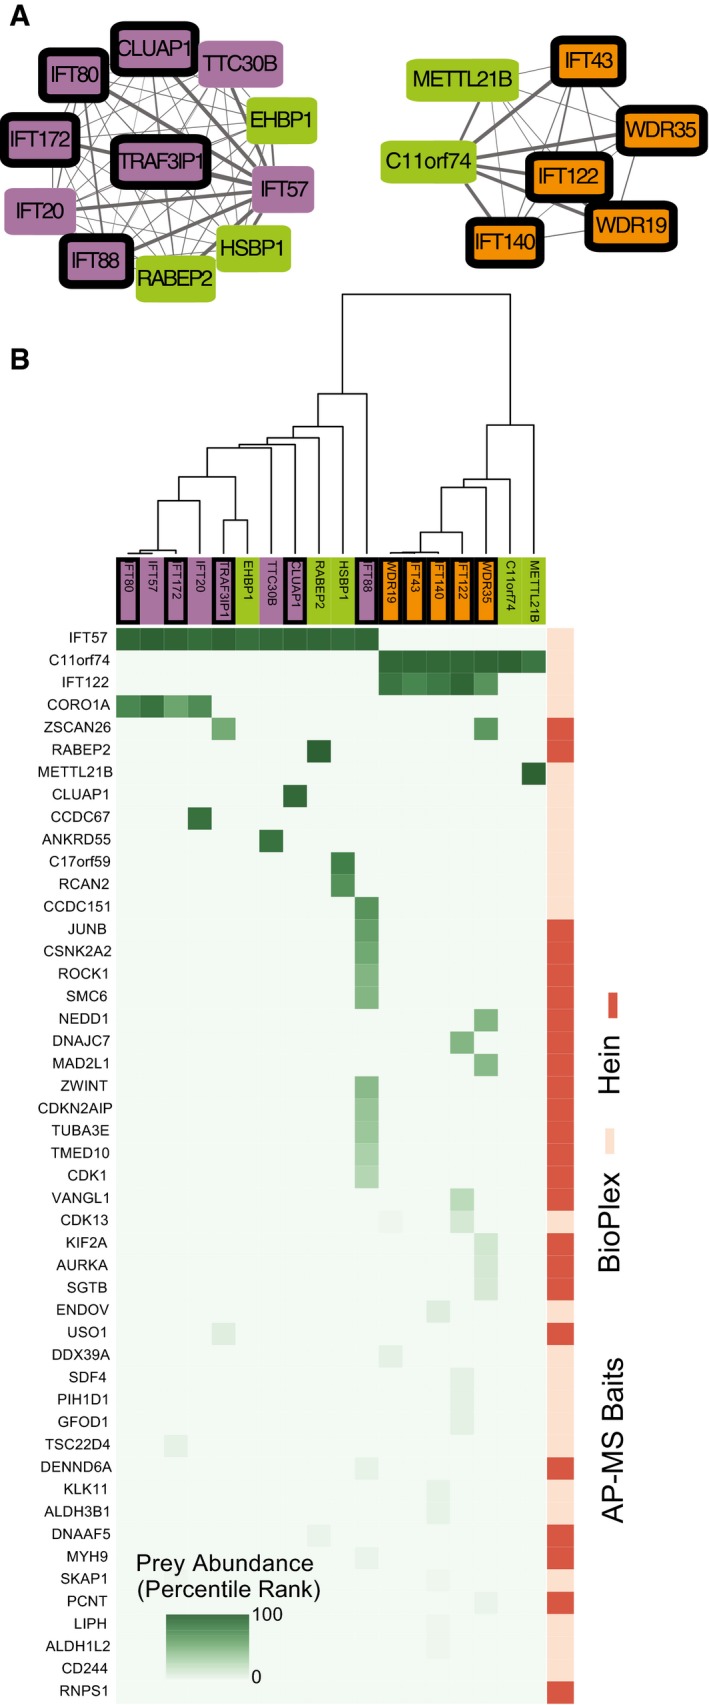
- Network view of IFT‐A and IFT‐B complexes. Node colors follow Fig 5 conventions.
- Matrix of AP‐MS experiments shows IFT‐A and IFT‐B are well separated and supported by multiple experiments.
Official websites use .gov
A
.gov website belongs to an official
government organization in the United States.
Secure .gov websites use HTTPS
A lock (
) or https:// means you've safely
connected to the .gov website. Share sensitive
information only on official, secure websites.