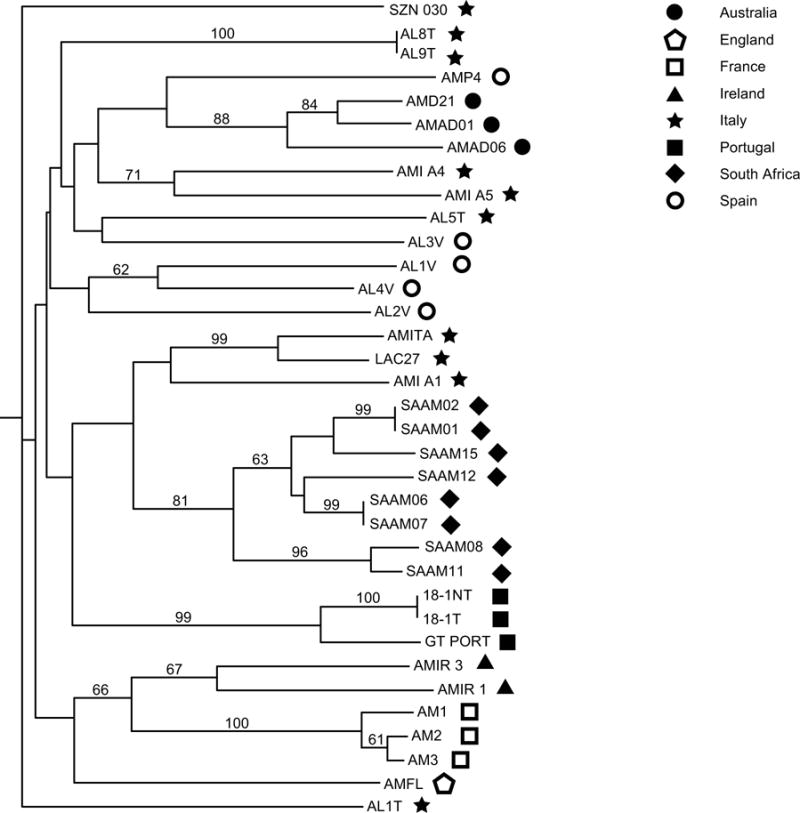
Figure 3.

Dendrogram generated from data collected from 12 microsatellite loci using the Nei algorithm (Nei 1979). Bootstrap values above 50% are shown. Strain AL1T was used as an outgroup. Symbols represent the general collection location and are consistent with symbols in Figures 1 and 2. Toxin producing characteristics are shown at the end of each branch (N = toxic, NT = non-toxic, ND = No data).
