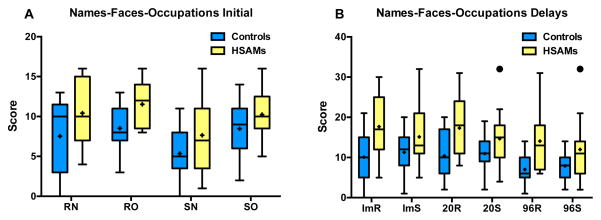
Figure 1. Names-Faces-Occupations Task.
Box and whisker plots (Tukey style; outliers in black dots) represent raw scores for each group. A) Recall for the initial test for each encoding task (R = rating, S = scenario) and information type (N = name, O = occupation). B) Recall across each delay (Im = immediate, 20 = 20 minute, 96 = 96 hours) for each encoding task (R = rating, S = scenario). “+” indicates average value

