Fig. 1.
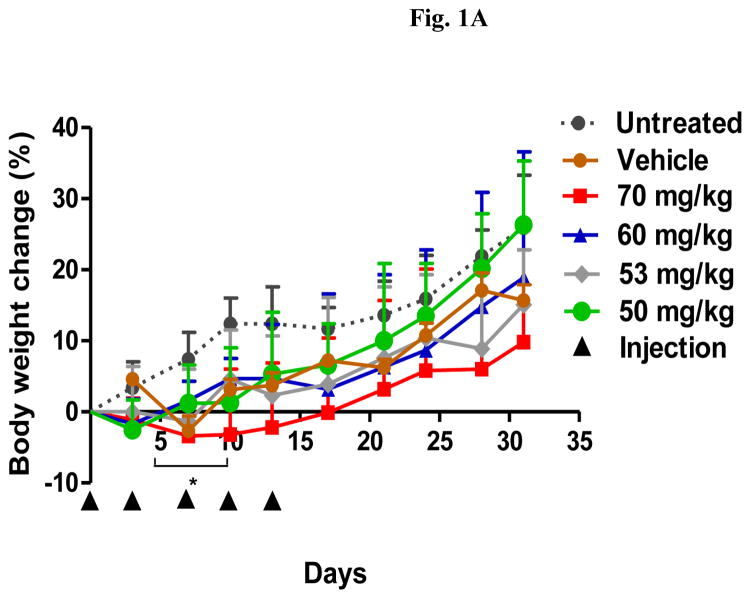
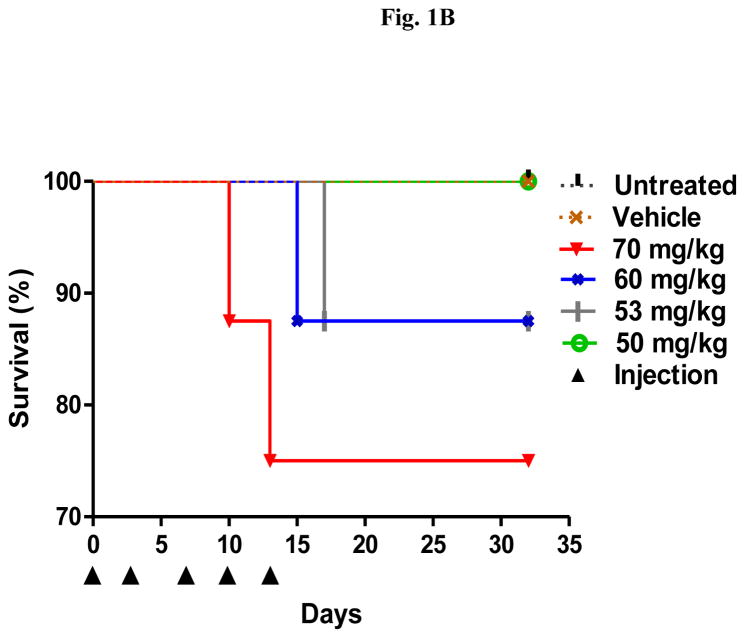
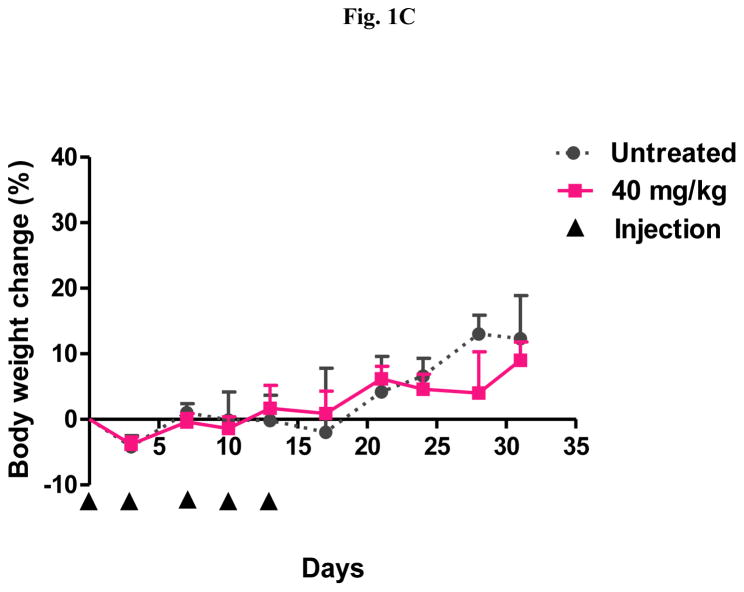
Identification of the RD-MTD of DHA-dFdC following five i.v. injections (on days 0, 3, 7, 10, and 13 (▲)) in healthy DBA/2 mice (n = 8). (A) Percent of body weight change (* p < 0.05, 70 mg/kg vs. Untreated, one-way ANOVA followed by a Bonferroni post hoc test). (B) Survival curves. Log-rank (Mantel-Cox) test did not reveal any significant difference among groups. (C) Percent of body weight change at 40 mg/kg of DHA-dFdC. Student’s t-test did not reveal any difference. In A and C, data shown are mean ± S.D.


