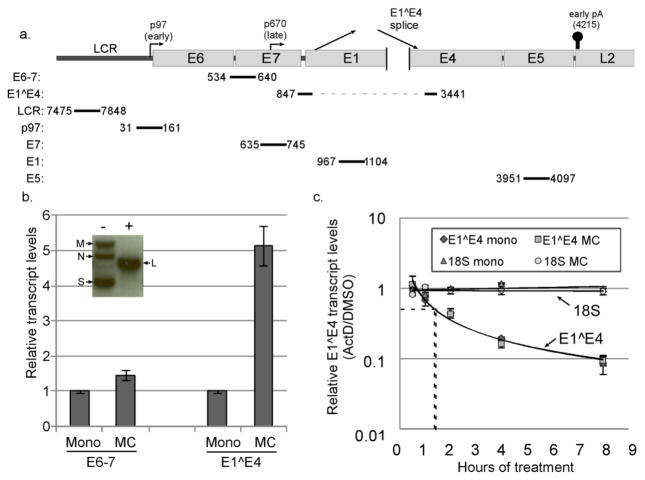
Figure 1.
The HPV16 late promoter is transcriptionally upregulated. a. Schematic diagram of the HPV16 genome showing the location of the long control region (LCR), early and late promoters, early polyadenylation signal, and the position of qPCR amplicons examined in this study. b. Inset: Southern blot analysis of DNA from HPV16 cells digested with a restriction enzyme that does not cut the viral genome (HindIII, -) or which cuts the genome once (BamHI, +), showing the supercoiled (S), nicked circular (N), multimeric (M), and linear bands (L) indicative of episomal maintenance of the HPV16 genome. Graph: Cells containing episomal HPV16 were cultured in either monolayer (mono) or methylcellulose (MC) for 24 hours. Total RNAs were isolated and subjected to RT-qPCR analysis using E6–7 or E1^E4 primers. Ct values were normalized to cyclophilin A (Cyc) as an internal control and then to the monolayer sample for each experiment. Values represent the means of 10 (E6–7) or 15 (E1^E4) independent experiments and bars represent ± one standard error of the mean. c. Cells grown in either monolayer or MC were treated with DMSO or actinomycin D (ActD, 5μg/μl) for the indicated time. Total RNAs were subjected to RT-qPCR for the E1^E4 spliced product or the 18S rRNA. Ct values were normalized to Cyc, and the corresponding DMSO control in monolayer or MC was set to 1. Dotted lines represent the t1/2 for each decay curve. Bars represent ± one standard error of the mean.

