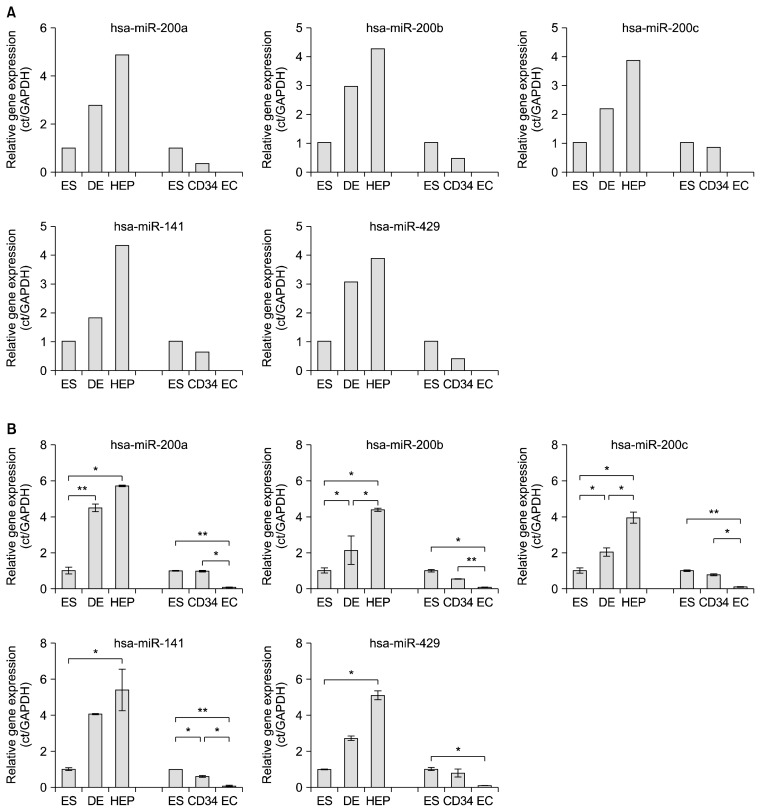
Fig. 3.
Quantification of microRNAs using qRT-PCR. (A) Relative expression levels of miR-200 family from the microarray results. ES, embryonic stem cells; DE, definitive endoderm; HEP, hepatocytes; CD34, CD34+ cells; EC, vascular endothelial cells. (B) Comparative quantification of miR-200 family in hESCs during differentiation into hepatocytes and vascular endothelial cells. *p<0.05, **p<0.01, n=3.

