Fig. 2.
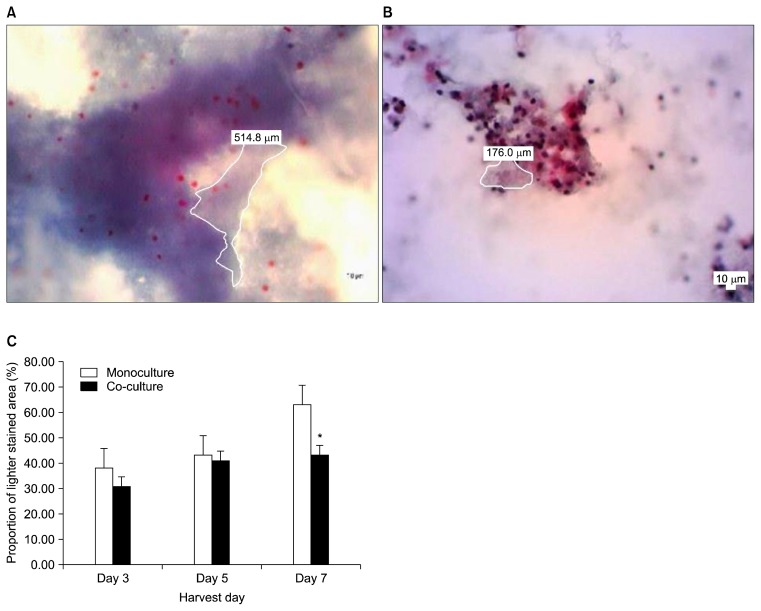
Comparison of extracellular matrix deposition with Masson Trichrome staining (400× magnification). (A) Microphotograph Masson’s Trichrome stained hanging drop mono-culture day 7 (400× magnification). (B) Microphotograph Masson’s Trichrome stained hanging drop co-culture day 7 (400× magnification). (C) Mean proportion of lighter stained area which indicate least abundant extracellular matrix deposition. *Indicate significant difference between mean proportion of mono-culture 3D with co-culture 3D.

