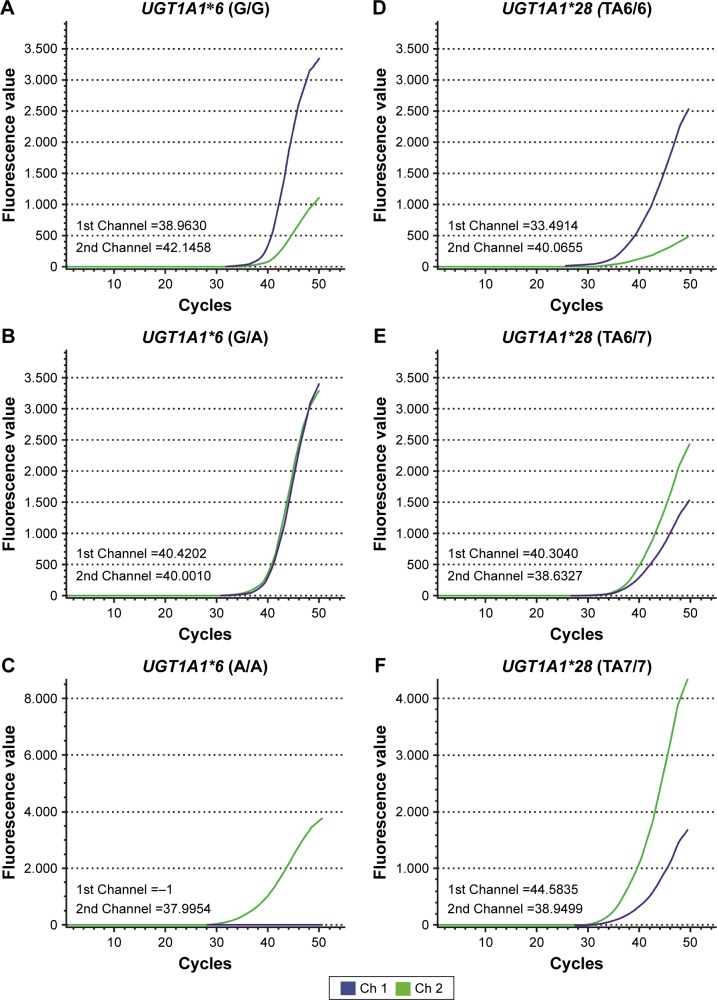
Figure 2.
UGT1A1 gene polymorphisms in patients.
Notes: Blood samples from the patients were analyzed by DFMH, and the results are as follows: (A) ΔST =−3.1828, representing UGT1A1*6 (G/G); (B) ΔST =0.4192, representing UGT1A1*6 (G/A); (C) ΔST =12.0046, representing UGT1A1*6 (A/A); (D) ΔST =−6.5741, representing UGT1A1*28 (TA6/6); (E) ΔST =1.6713, representing UGT1A1*28 (TA6/7); and (F) ΔST =5.6336, representing UGT1A1*28 (TA7/7).
Abbreviations: DFMH, digital fluorescence molecular hybridization; ST, signal intensity.

