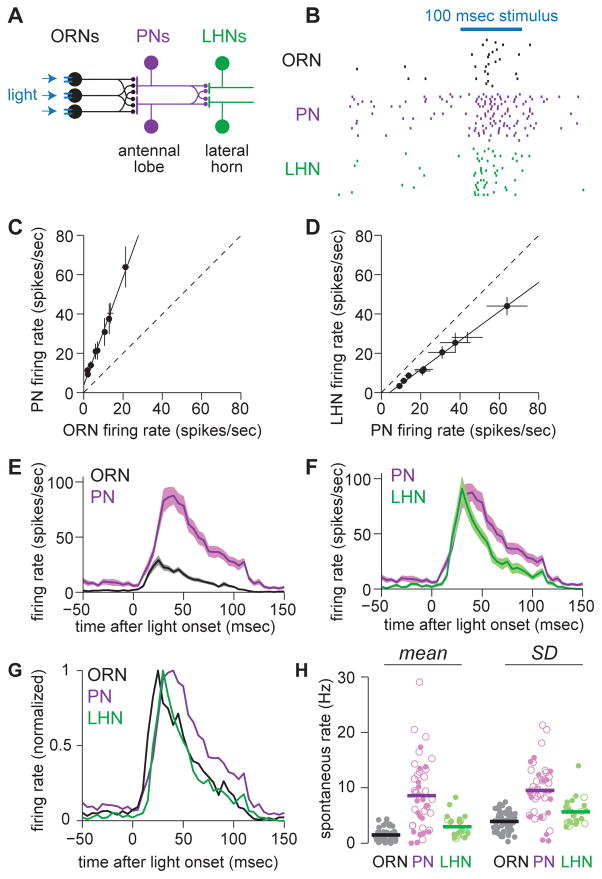
Figure 1. Sensory processing across three layers of olfactory circuitry.
(A) Schematic of feedforward circuitry from a single olfactory glomerulus (DA1). About 40 ORNs in each antenna project to this glomerulus. Each ORN axon diverges to contact all the PNs in this glomerulus, and conversely each PN receives convergent input from all 40 ORNs. PN axons then reconverge onto LHNs. ORNs express channelrhodopsin-2, and we use light to inject a brief packet of spikes into the ORNs.
(B) Rasters showing spikes in a DA1 ORN, a DA1 PN, and a postsynaptic LHN in response to repeated presentations of the primary stimulus used throughout this study (a 100 msec flash).
(C) ORN and PN firing rates evoked by a range of optogenetic stimuli of different intensities. Each symbol represents a different stimulus. The open circle denotes the primary stimulus used throughout this study. Dashed line denotes unity slope.
(D) As in (C), but for PN and LHN firing rates. PN-LHN gain is lower than ORN-PN gain (ANCOVA, p = 7.6 × 10⁻¹³).
(E) Mean firing rate over time in ORNs and PNs (± s.e.m. across cells, n=58 ORNs and 44 PNs).
(F) As in (E) but comparing PNs and LHNs (n=25 LHNs).
(G) Mean firing rates from (E,F) normalized to their peak.
(H) Spontaneous firing rates, mean (left) and standard deviation (right). Each symbol is a different recording (open circles are cell-attached recordings, filled circles are whole-cell current clamp recordings). Mean rates are higher in PNs than in ORNs (t-test, p = 2.4×10⁻¹³) or LHNs (t-test, p = 5.1×10⁻⁵). Standard deviations are also higher in PNs than in ORNs (t-test, 3.7×10⁻¹³) or LHNs (t-test, 3.0×10⁻⁴).

