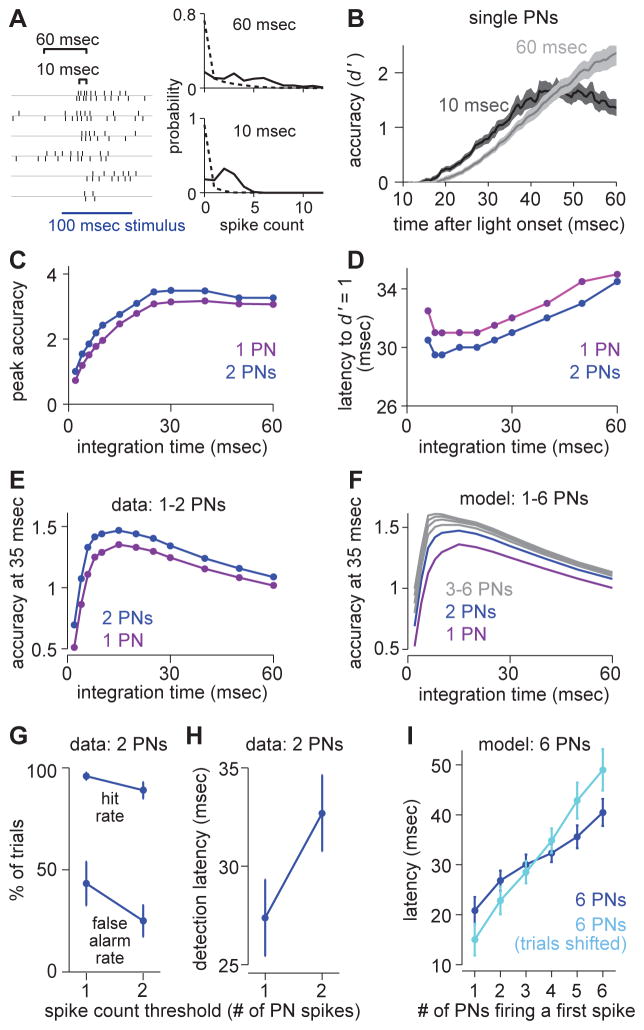
Figure 6. A decoder of PN population activity faces a speed-accuracy tradeoff.
(A) Comparing different integration windows by counting spikes from pairs of PNs (or single PNs) in sliding windows of variable length (i.e., a variable integration time). At each time point, we construct spike count histograms and measure the separation between spontaneous and evoked activity (stimulus detection accuracy) using d′.
(B) Accuracy (d′) over time based on spike trains from a single PN (mean ± s.e.m. over PNs).
(C) Peak detection accuracy versus integration time, averaged over all PN pairs or the single PNs included in these pairs. Accuracy (single PNs) increases with integration time (ANOVA, p = 7.2 × 10⁻⁴). Accuracy is higher for PN pairs than for single PNs (ANOVA, p = 0.0142). This and all subsequent panels in this figure are computed on the same data set (n = 8 PN pairs).
(D) Mean latency to baseline accuracy (d′ = 1) versus integration time. Latency increases with integration time (single PNs, ANOVA, p = 5.6 × 10⁻⁴). Latencies are shorter for PN pairs than for single PNs (ANOVA, p = 0.0090). Latency is not calculated for windows of 4 msec or shorter, because several (single) PNs never reach baseline accuracy.
(E) Mean accuracy versus integration time, evaluated at 35 msec after stimulus onset. Accuracy is maximal for decoders that integrate over 10–20 msec. Accuracy is higher for PN pairs than for single PNs (ANOVA, p = 6.0 × 10⁻⁴). The improvement in accuracy with pairs is significantly greater for short timescales than for long timescales (ANOVA, interaction between population size and integration time: p = 0.0045).
(F) Same as E but for modeled PN populations ranging in size from 1 PN to 6 PNs. Spike counts in PN populations were simulated based on distributions from paired PN data (Supplemental Experimental Procedures).
(G) Hit rates and false alarm rates for a binary classifier (with a 10-ms integration window, mean ± s.e.m), for two different thresholds (one spike or two spikes, pooled over a pair of sister PNs). The higher threshold produces a higher net accuracy (paired t-test, p = 0.0189).
(H) Detection latencies for the binary classifier in G, for the same two thresholds. The higher threshold imposes a speed cost of about 5 msec (paired t-test, p = 0.0073).
(I) In a modeled population of 6 PNs, mean latency for a given number of these PNs to fire a first spike after stimulus onset. First PN spike distributions were simulated based on distributions from paired PN data (Supplemental Experimental Procedures). When trials were shifted to remove correlations, latencies became longer for higher thresholds.

