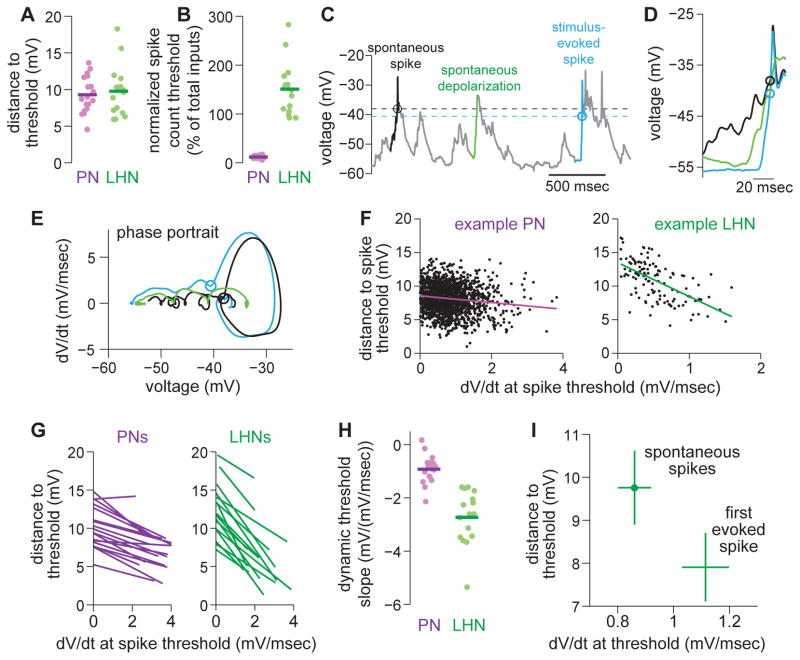
Figure 7. LHNs operate with a high, but dynamic, spike count threshold.
(A) Distance to spike threshold for PNs and LHNs. Each symbol is a different recording. This and subsequent group-data panels in this figure are computed on the same data set (n = 18 PNs and 16 LHNs).
(B) Same but normalized by the estimated typical EPSP amplitude for each cell type (2 mV for PNs, 1.08mV for LHNs, see Figure 5C and Supplemental Experimental Procedures) and also normalized by the size of the presynaptic pool (here assumed to be 40 ORNs and 6 PNs). This value represents the percentage of the total presynaptic pool that must spike nearly-synchronously to drive the postsynaptic cell above threshold.
(C) A typical whole-cell current clamp recording from an LHN highlighting two spikes (black and blue), and also a depolarization that does not evoke a spike (green). Circles and dashed lines denote spike thresholds.
(D) Brief snippets of voltage surrounding the two spikes and the non-spiking depolarization (from C).
(E) Phase portrait (dV/dt vs. V) for these three snippets.
(F) Distance to spike threshold versus rate of depolarization for all spikes (spontaneous and stimulus-evoked) recorded from a typical PN and LHN.
(G) Linear regression fits (like those in F) for all PNs and LHNs. Each line represents a different recording.
(H) Slopes of linear regression fits from G for all PNs and LHNs. Distance to threshold depends on dV/dt more strongly in LHNs than in PNs (t-test, p = 1.9 × 10⁻⁷).
(I) Distance to threshold versus dV/dt in LHNs. Spikes in two categories were analyzed—namely, spontaneous spikes and the first stimulus-evoked spike. Distance to threshold is significantly lower for the first stimulus-evoked spike (paired t-test, p = 6.2 × 10⁻⁴). dV/dt is also significantly higher for the first stimulus-evoked spike (paired t-test, p = 0.0024).

