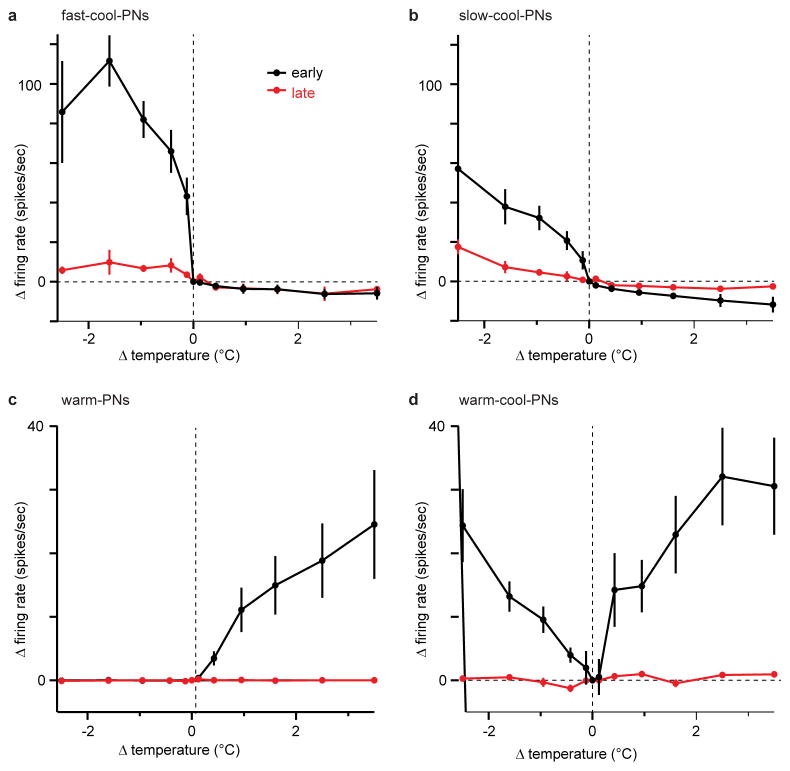
Extended Data Figure 3. Adaptation to small temperature steps.
Sensitivity to small temperature steps, shown as the mean change in firing rate versus the change in temperature, averaged across experiments, ± s.e.m. (n = 5–9). Data in red are measured during a late period after stimulus onset (from 4 to 5 s after valve opening). Data in black are measured during an early period after stimulus onset (from 100 to 400 ms after valve opening, except for the warm-cool-PNs, where it was from 100 to 200 ms). Data in black are reproduced from Figure 1a (fast-cool-PNs), Figure 1b (slow-cool-PNs), Figure 2 (warm-PNs), and Extended Data Figure 7 (warm-cool-PNs). Note that slow-cool-PNs show little adaptation to large temperature steps (Figure 1b). However, their responses to small steps adapt strongly, like those of the other PN types.

