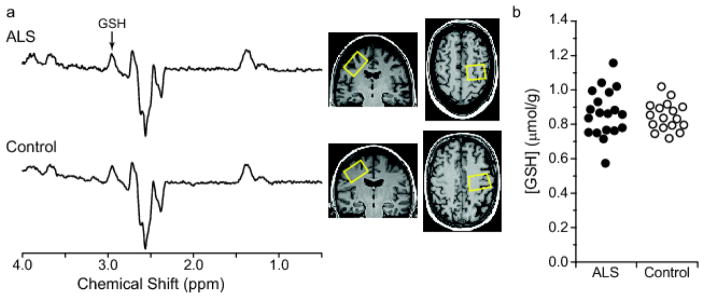
Fig. 2.
GSH-edited spectra and GSH concentrations from the motor cortex of subjects with ALS and healthy controls using MEGA-PRESS at 3 T (TE = 68 ms, TR = 2 s, 512 averages). (a) Representative difference spectra acquired in a subject with ALS (top) and healthy control (bottom). Motor cortex voxel placement (3.5 × 2.5 × 2.3 cm3) is shown on T1-weighted images. Spectra are shown with 1-Hz exponential line broadening and with vertical scale adjusted using NAA resonance. (b) GSH concentrations quantified using LCModel in subjects with ALS and controls; p = 0.6 from ANOVA adjusting for brain hemisphere scanned

