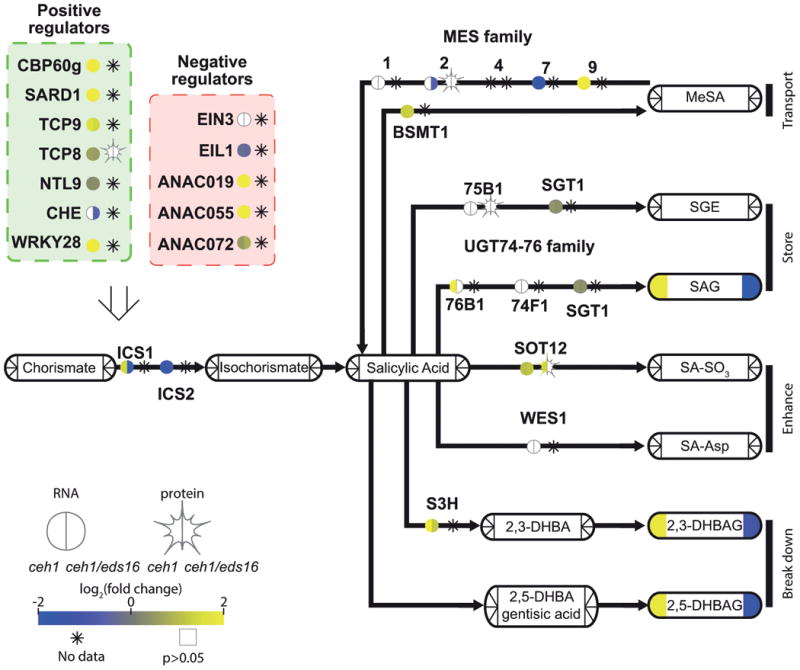
Figure 3. Salicylic acid biosynthesis and degradation is regulated by MEcPP.

A pathway schematic for SA biosynthesis and breakdown, with transcription factors/enzymes shown by bare text with a circle, representing RNA, and star, representing protein levels. Metabolites are shown by rounded rectangles. For metabolites, RNA, and protein, the log2-fold change for ceh1 vs parent (left) and ceh1/eds16 vs. parent (right) is represented by shading, from -2 (darkest) to 2 (lightest). Non-detectable products in each section are shown by an asterisk, while empty symbols with grey borders represent non-significant fold changes relative to parent. Arrows represent chemical conversions, catalyzed by the enzymes shown on the line. The open arrow from transcription factors to ICS1 represents direct transcriptional regulation of this enzyme by these transcription factors. Abbreviations: CBP60g: calmodulin-binding protein 60g, SARD1: systemic acquired resistance deficient 1, TCP8/9: teosinte branched 1, cycloidea, PCF domain containing 8/9, NTL9: NTM1-like 9, CHE: CCA1 hiking expedition, EIN3: ethylene-insensitive 3, EIL1: EIN3-like1, ANAC019,055,072: Arabidopsis Nam/ATAF1,CUC2-domain containing TF 19/55/72, ICS1/2: isochorismate synthase ½, MES: methyl esterase, BSMT: SA methyl transferase, MeSA: methyl-salicylic acid, UGT: UDP-glucose transferase, SGT: SA glucose transferase, SGE: salicylate glucose ester, SAG: salicylic acid glucoside, SOT12: sulphotransferase 12, SA-SO3: sulphosalicylic acid, WES1: =GH3.5 WESO1, S3H: salicylate-3-hydroxylase, DHBA: dihydroxybenzoic acid, DHBAG: DHBA glucoside
