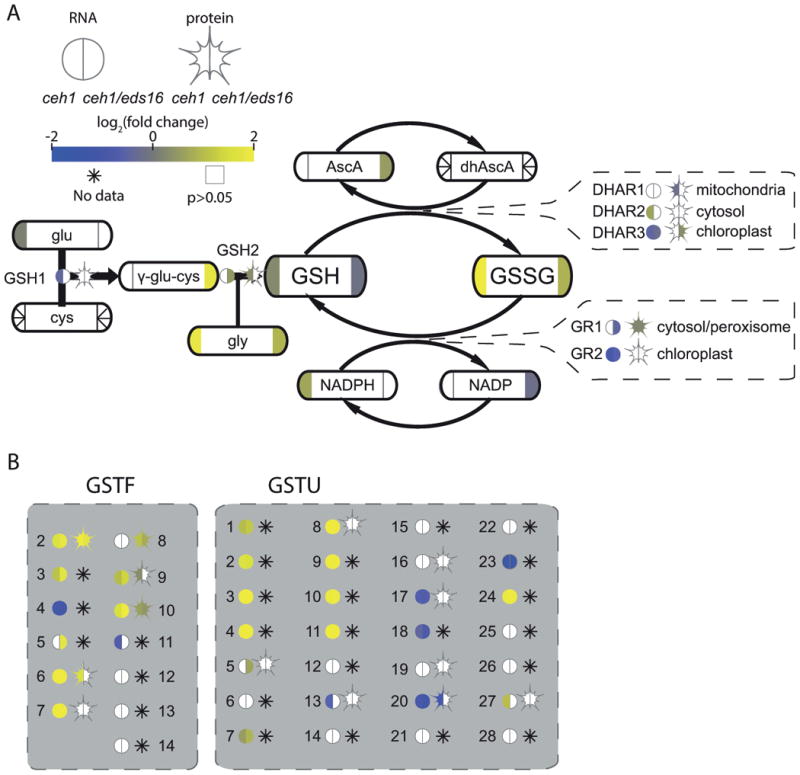
Figure 5. MEcPP influences glutathione redox balance and function.

(A) A partial simplified pathway schematic for glutathione biosynthesis and function, with enzymes shown by bare text with a circle, representing RNA, and star, representing protein levels. Metabolites are shown by rounded rectangles. For metabolites, RNA, and protein, the log2-fold change for ceh1 vs parent (left) and ceh1/eds16 vs. parent (right) is represented by shading, from -2 (darkest) to 2 (lightest). Non-detectable products in each section are shown by an asterisk, while empty symbols with grey borders represent non-significant fold changes relative to parent. Arrows represent chemical conversions, catalyzed by the enzymes shown on the line. Callouts for the DHAR and GR enzyme families also show subcellular localization of these enzymes. (B) Glutathione S-transferases of the phi (GSTF) and tau (GSTU) families are shown in grey boxes. Abbreviations: glu: glutamate, cys: cysteine, GSH1: (=γ-ECS1, RML1, PAD2) glutathione synthetase 1, gly: glycine, GSH1: glutathione synthetase 2, GSH: reduced glutathione, GSSG: oxidized glutathione, AscA: ascorbic acid, dhAscA: dehydroxyascorbic acid, DHAR: dehydroxyascorbic acid reductase, GR: glutathione reductase, GSTF: glutathiose S-transferase phi family, GSTU: glutathione S-transferase tau family.
