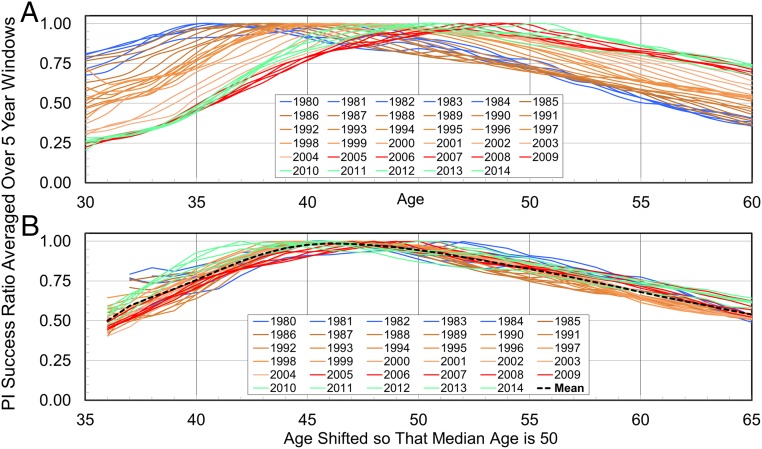
Fig. 5.
The PI success ratio. A shows that, since 1980, the PI success ratio, defined as the ratio of the number of R01 grantees to the number of basic-science PIs of the same age in the same 5-y range, has dropped for PIs younger than 40 and increased for PIs older than 50 (years are blue to green lines). Each curve is normalized to have a maximum value of 1.00. B shows these same curves shifted along the x axis so that the median age of a R01 grantee is 50 (average median age for 2008–2014) using median grantee ages from Fig. 1. Note how the green lines for years 2010–2014 have risen noticeably for PIs younger than 45, rising well above the mean level. This is likely due to boosting of early-stage investigators (ESIs) implemented by NIH after 2008 (27).

