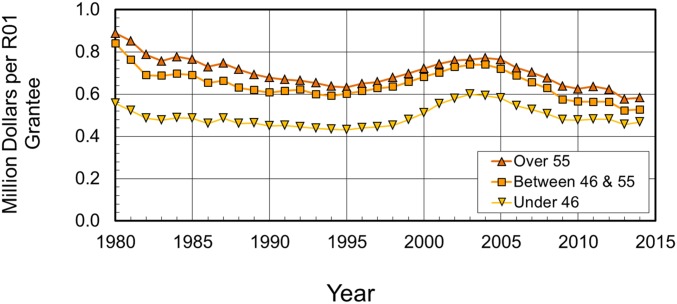
Fig. S3.
This figure shows the variation with year of the annual funding per R01 grantees in each of the three age ranges. This funding in inflation-corrected (BRDPI) dollars has been surprisingly constant for each range at 0.49 ± 0.05, 0.65 ± 0.07, and 0.70 ± 0.07 M$ for under 46, between 46 and 55, and over 55, respectively, with a SD that is almost exactly 10% in each case. When the congressional appropriation doubled between 1999 and 2005, funds for each age range increased by 20%, 13%, and 10% for under 46, between 46 and 55, and over 55, respectively. Despite the greater allocation of funds to under 46, the decrease in their numbers continued unabatedly (Fig. 4).

